Performance is a critical aspect of any application. Understanding how your program utilizes CPU resources can provide valuable insights into potential bottlenecks and areas for optimization. One of the most effective ways to visualize CPU usage is through a flame chart, a graphical representation of your program’s call stack over time.
In the realm of Go, a statically typed, compiled language renowned for its simplicity and efficiency, we have robust built-in tools for performance analysis. One of these tools is the pprof package, which allows us to profile CPU usage among other things.
In this article, we will explore how to generate a CPU profile for a Go service, analyze it using pprof, and visualize the data with a flame chart. By the end of this guide, you’ll have a solid foundation for diagnosing performance issues and optimizing your Go applications.
Prerequisites
Before we dive into the process of generating and analyzing a CPU profile for a Go service, there are a few prerequisites you’ll need:
Go: You should have Go installed on your machine. If you haven’t installed it yet, you can download it from the official Go website. This tutorial assumes you have a basic understanding of Go programming.
pprof: pprof is a tool for visualization and analysis of profiling data. It’s part of the Go standard library, so if you have Go installed, you already have pprof.
Basic Understanding of Go Profiling: While we’ll cover the basics of CPU profiling in Go, it’s helpful if you have a basic understanding of the concept. If you’re new to profiling, you might find the Go blog post on profiling helpful.
With these prerequisites in place, you’re ready to start profiling your Go services.
Enabling CPU Profiling in a Go Service
To enable CPU profiling in a Go service, you need to import the net/http/pprof package. This package automatically registers an HTTP handler for profiling data at /debug/pprof/.
Here’s how you can do it:
import (
    "net/http"
    _ "net/http/pprof" // This line is important
)

func main() {
    // Start the HTTP server
    http.ListenAndServe(":8080", nil)
}
In the code above, we import the net/http/pprof package with an underscore (_). This is known as a blank import, and it’s used when we want to import a package solely for its side effects, without using any of its exported identifiers. In this case, the side effect is that the net/http/pprof package automatically registers an HTTP handler at /debug/pprof/.
Now, if you run your Go service and navigate to http://localhost:8080/debug/pprof/ in your web browser, you’ll see a page with several profiling options. One of these options is profile, which generates a CPU profile.
In the next section, we’ll discuss how to generate and download a CPU profile.
Generating the CPU Profile
Once you’ve enabled CPU profiling in your Go service, generating a CPU profile is as simple as sending a GET request to the /debug/pprof/profile endpoint. This endpoint generates a CPU profile and writes it as a response.
Here’s how you can generate a CPU profile:
- Start your Go service: Run your Go service that has the
net/http/pprofpackage imported. - Send a GET request to the profiling endpoint: You can use a tool like
curlto send a GET request tohttp://localhost:8080/debug/pprof/profile. Replacelocalhost:8080with the address of your Go service if it’s different.
curl http://localhost:8080/debug/pprof/profile?seconds=30 > cpu.pprof
In the command above, we’re using the seconds query parameter to specify how long the profiling should last. In this case, we’re profiling for 30 seconds. The output is written to a file named cpu.pprof.
Now you have a CPU profile for your Go service! In the next section, we’ll discuss how to analyze this profile using go tool pprof.
Analyzing the CPU Profile with pprof Web UI
Once you’ve generated the CPU profile, you can analyze it using the pprof web interface. This tool reads the profile data and provides an interactive web-based interface to explore the data and generate visualizations.
Start the pprof web interface: Run the following command in your terminal to start the pprof web interface:
go tool pprof -http=:8080 cpu.pprof
This command starts a web server at localhost:8080 and opens the pprof web interface in your default web browser.
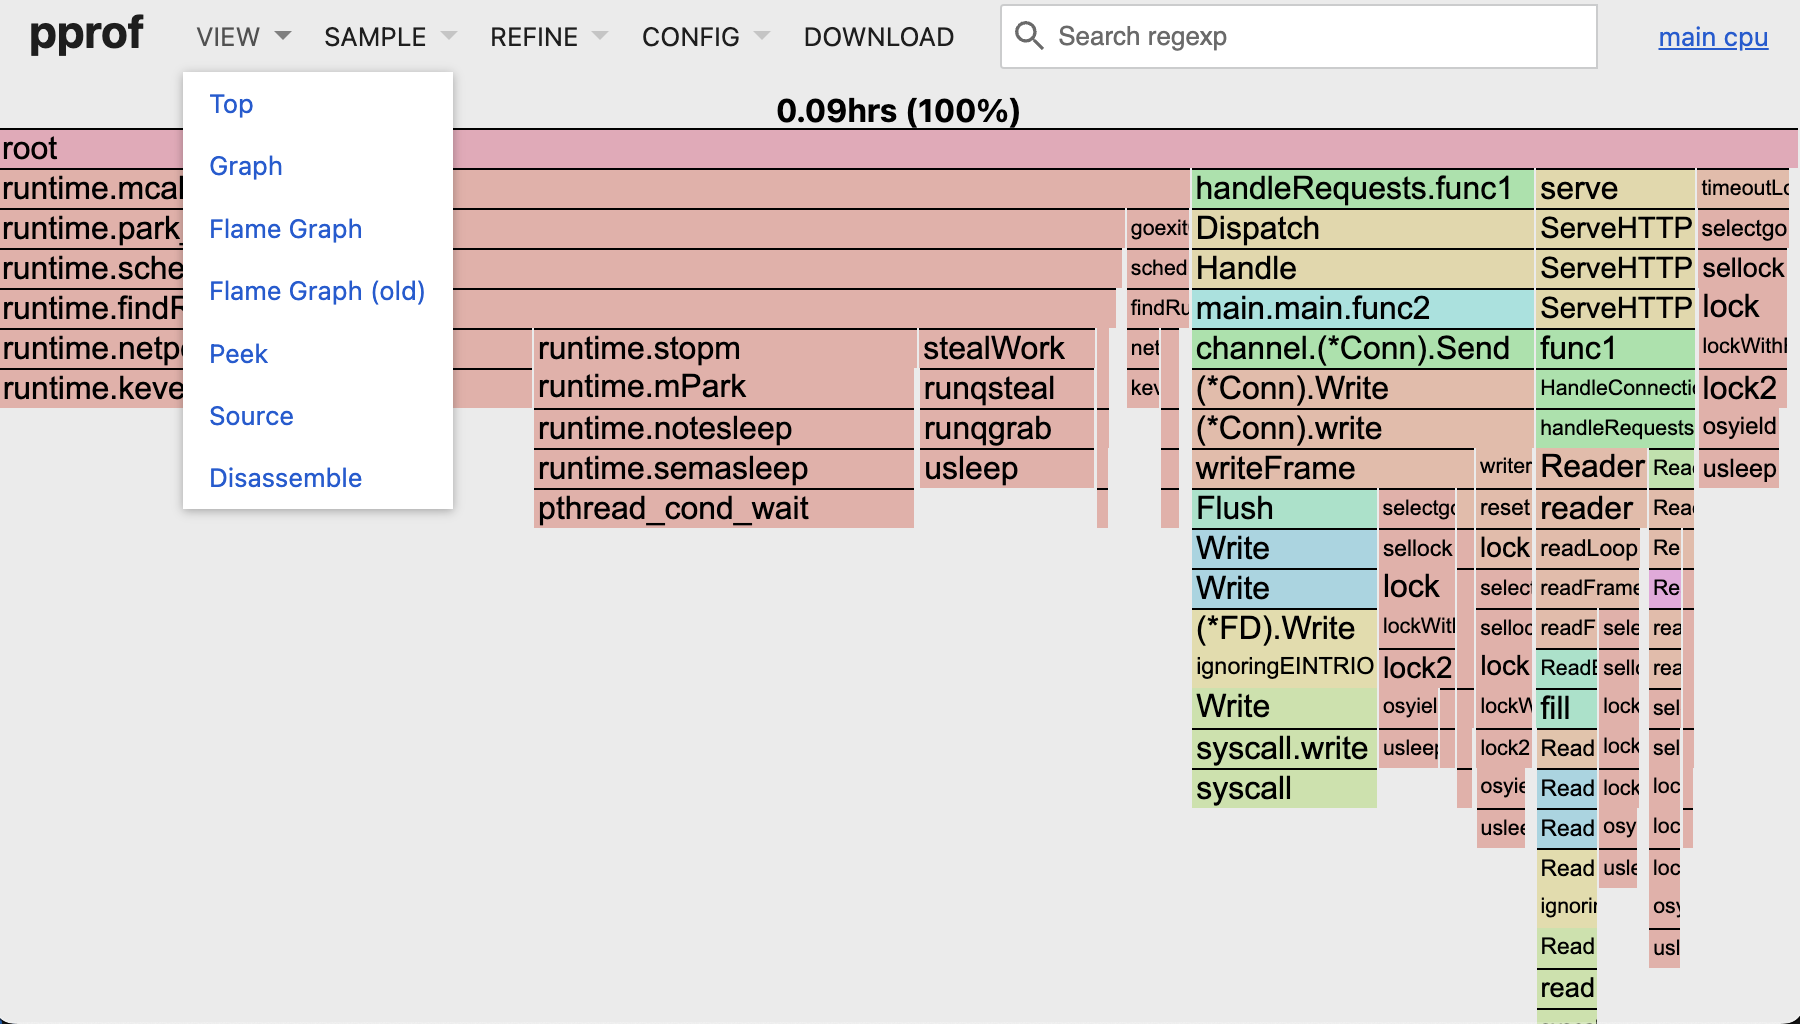
The pprof web interface provides several views of the profile data:
- Top: This view lists the functions that consume the most CPU time. The list is sorted by the amount of CPU time consumed, with the function that consumes the most time at the top.
- Graph: This view shows a directed graph where nodes represent functions and edges represent function calls. The size and color of the nodes indicate the amount of CPU time consumed by the function.
- Flame Graph: This view shows a flame graph of the CPU usage. Each bar represents a function, and the width of the bar represents the amount of CPU time consumed by the function. The y-axis shows the stack depth, with the currently executing function at the top.
- Peek: This view shows the CPU consumption statistics for each line of code in the selected function.
- Source: This view shows the source code of the selected function, with lines highlighted based on the amount of CPU time consumed.
By exploring these views, you can gain insights into which functions consume the most CPU time, how functions call each other, and which lines of code are the most CPU-intensive. This information can help you optimize your Go service for better performance.
Conclusion
Profiling is an essential aspect of performance optimization in any software development process. In Go, the built-in pprof tool provides a robust and convenient way to generate and analyze CPU profiles.
Throughout this article, we’ve walked through the steps of generating a CPU profile, starting from running your Go program with the pprof package, to saving the profile to a file. We’ve also explored how to analyze this profile using the pprof command-line interface and its web interface, which provides several insightful views of the profile data.
Regular performance analysis using tools like pprof can lead to significant improvements in your Go applications. It allows you to identify CPU-intensive functions and lines of code, enabling targeted optimization efforts.
It’s important to note that CPU profiling works by sampling the call stack at regular intervals. This means it provides an approximation of where CPU time is spent. However, with a high enough sampling rate, this approximation can be very accurate and extremely useful in identifying performance bottlenecks.
In conclusion, understanding and utilizing CPU profiling is a powerful skill in a Go developer’s toolkit. It’s a process that can help you write more efficient, performant Go code and build applications that scale effectively.
Happy profiling!
